TPG stack on G5K + FIT IoT LAB
Experiment Artifacts
The artifacts repository contains the E2Clab configuration files such as
layers_services.yaml, network.yaml, and workflow.yaml
$ cd ~/git/
$ git clone https://gitlab.inria.fr/E2Clab/examples/monitoring-tpg-g5k-iotlab.git
$ cd monitoring-tpg-g5k-iotlab/
Defining the Experimental Environment
Layers & Services Configuration
The monitoring type is tpg with the provider (machine hosting Prometheus and
Grafana) on the g5k testbed (paravance cluster). The network is shared
(experiment data and monitoring data are on the same network). We use an IPv6
network (FIT IoT LAB devices use IPv6 network). Finally, we added roles: [monitoring]
in all services (e.g., MyServer, MyClientA, and MyClientB) for tpg monitoring.
 1---
 2environment:
 3  job_name: monitoring-tpg-g5k-iotlab
 4  walltime: "00:59:00"
 5  g5k:
 6    cluster: paravance
 7    job_type: ["allow_classic_ssh"]
 8  iotlab:
 9    cluster: grenoble
10monitoring:
11  type: tpg
12  provider: g5k
13  cluster: paravance
14  network: shared
15  ipv: 6
16layers:
17- name: cloud
18  services:
19  - name: MyServer
20    environment: g5k
21    roles: [monitoring]
22    quantity: 1
23- name: edge
24  services:
25  - name: MyClientA
26    environment: iotlab
27    cluster: grenoble
28    archi: a8:at86rf231
29    roles: [monitoring]
30    quantity: 1
31  - name: MyClientB
32    environment: iotlab
33    cluster: grenoble
34    archi: rpi3:at86rf233
35    roles: [monitoring]
36    quantity: 1
Network Configuration
1networks:
2- src: cloud
3  dst: edge
4  delay: 180ms
5  rate: 1gbit
6  loss: 0.1%
Workflow Configuration
prepare installs stress on all Services.
launch runs stress on all Services.
 1# SERVER
 2- hosts: cloud.*
 3  prepare:
 4    - shell: apt install -y stress
 5  launch:
 6    - debug:
 7        msg: "Running"
 8    - shell: stress --cpu 32 --timeout 30
 9      async: 30
10      poll: 0
11# CLIENT
12- hosts: edge.myclienta.*
13  prepare:
14    - shell: pip3 install stress
15  launch:
16    - debug:
17        msg: "Running"
18    - shell: stress -c 1
19      async: 30
20      poll: 0
21- hosts: edge.myclientb.*
22  prepare:
23    - shell: pip3 install stress
24  launch:
25    - debug:
26        msg: "Running"
27    - shell: stress -c 4
28      async: 30
29      poll: 0
Running & Verifying Experiment Results
Find below the commands to run this example.
$ e2clab layers-services ~/git/monitoring-tpg-g5k-iotlab/
                         ~/git/monitoring-tpg-g5k-iotlab/
$ e2clab workflow ~/git/monitoring-tpg-g5k-iotlab/ prepare
$ e2clab workflow ~/git/monitoring-tpg-g5k-iotlab/ launch
You can access the Grafana service to visualize monitoring data during experiment
execution. You can access it as described in the following file
~/git/monitoring-tpg-g5k-iotlab/20231013-111406/layers_services-validate.yaml. See
more details below:
'* * * * * * * Monitoring Service (started during workflow ''launch'' step)'
'Available at: http://localhost:3000'
'Access from your local machine: ssh -NL 3000:localhost:3000 paravance-40.rennes.grid5000.fr'
'username: admin / password: admin'
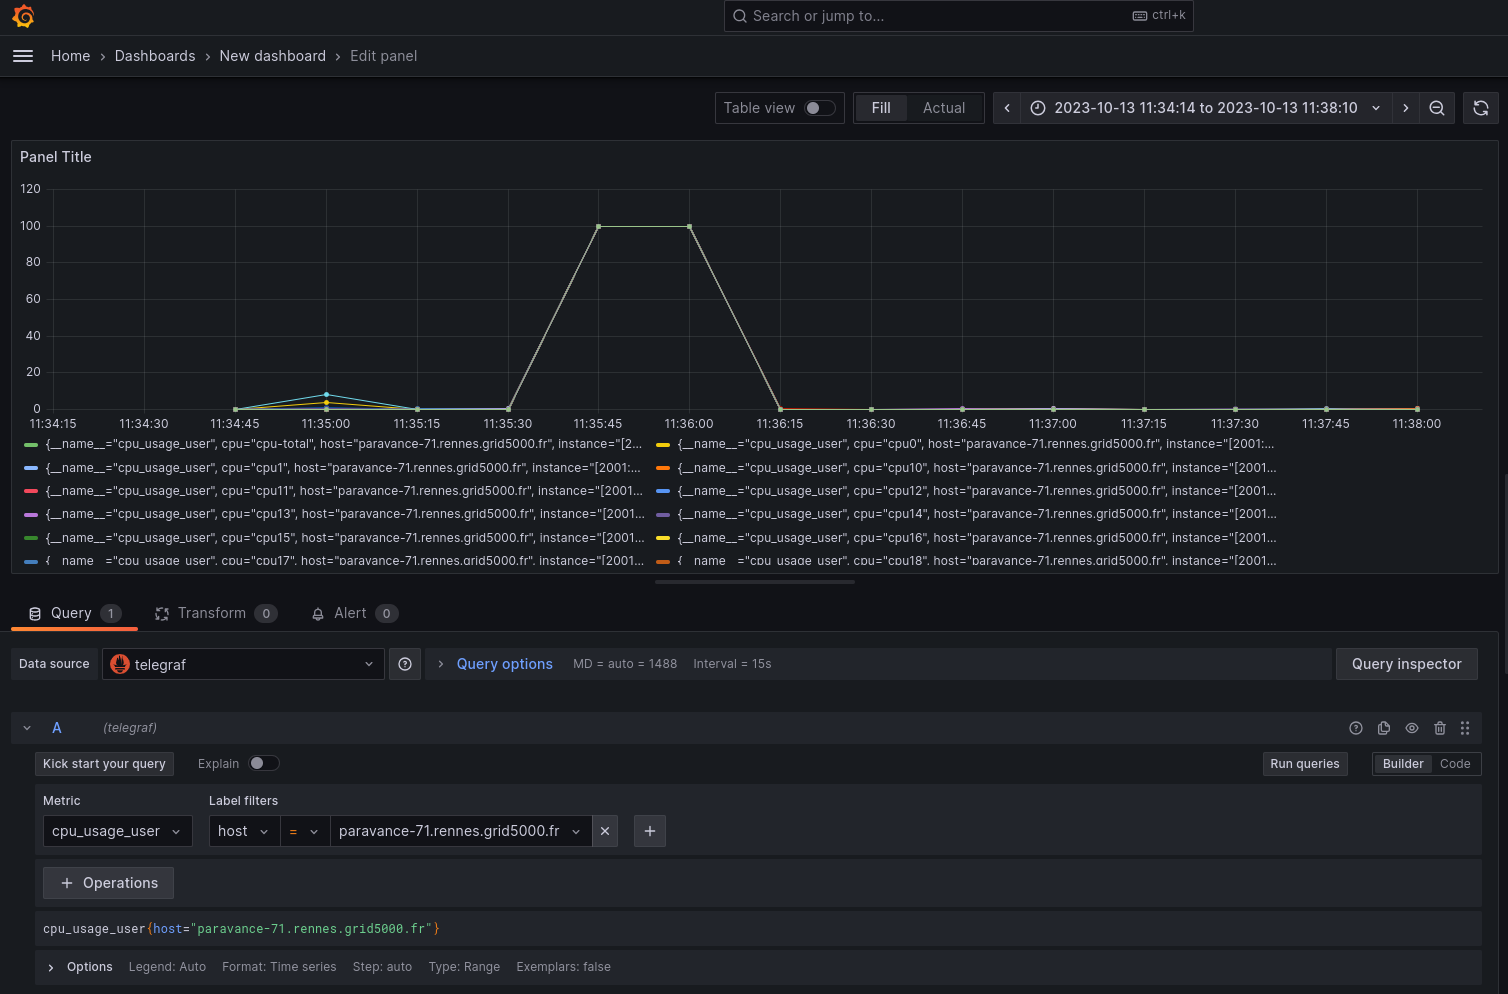
Figure 1: CPU usage on G5K node ‘MyServer’.
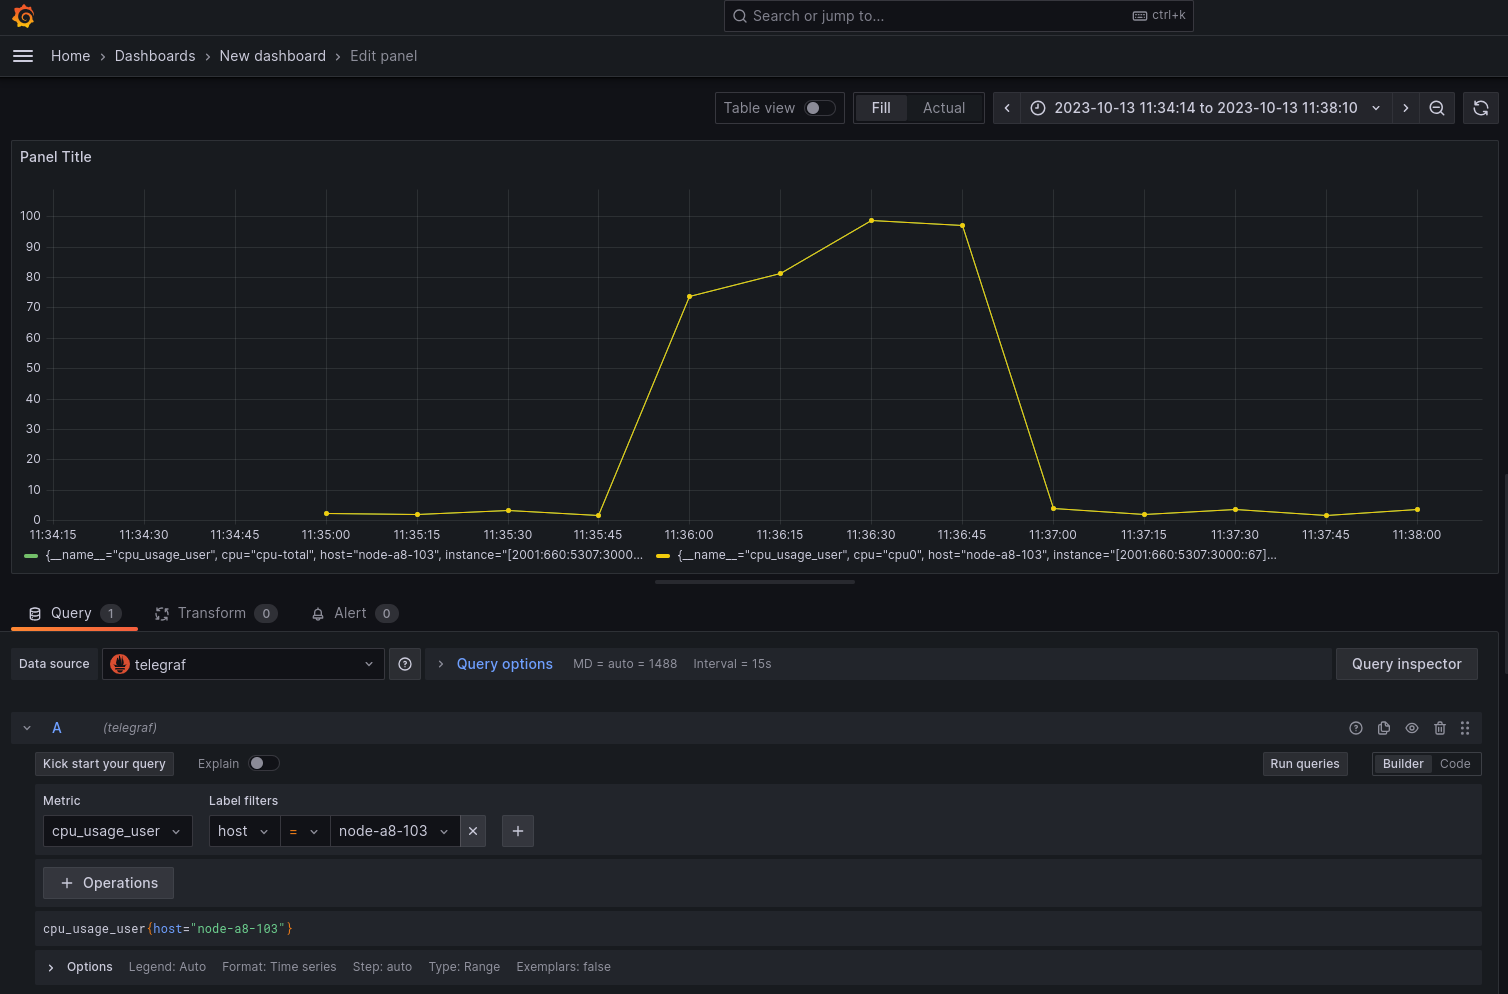
Figure 2: CPU usage on FIT IoT a8 device ‘MyClientA’.
Wait at least one minute before finalizing the workflow and saving the monitoring data.
$ e2clab finalize ~/git/monitoring-tpg-g5k-iotlab/
The monitoring data will be saved at:
$ ls ~/git/monitoring-tpg-g5k-iotlab/20231013-111406/monitoring-data/
20231013T094209Z-7052d33e19ef5be9.tar.gz