TIG stack on Chameleon
Experiment Artifacts
The artifacts repository contains the E2Clab configuration files such as
layers_services.yaml, network.yaml, and workflow.yaml
$ cd ~/git/
$ git clone https://gitlab.inria.fr/E2Clab/examples/monitoring-tig-chameleon.git
$ cd monitoring-tig-chameleon/
Defining the Experimental Environment
Layers & Services Configuration
The monitoring type is tig with the provider (machine hosting InfluxDB and
Grafana) on the chameleoncloud testbed (compute_cascadelake_r cluster). Finally, we
added roles: [monitoring] in all services (e.g., Server and Client) for tig
monitoring.
 1---
 2environment:
 3  job_name: monitoring-tig-chameleon
 4  walltime: "02:00:00"
 5  chameleoncloud:
 6    key_name: drosendo-g5k
 7    rc_file: "/path/to/credential/file/my-app-cred-cloud-openrc.sh"
 8    image: CC-Ubuntu20.04
 9monitoring:
10  type: tig
11  provider: chameleoncloud
12  cluster: compute_cascadelake_r
13layers:
14- name: cloud
15  services:
16  - name: Server
17    environment: chameleoncloud
18    cluster: compute_cascadelake_r
19    roles: [monitoring]
20    quantity: 1
21- name: edge
22  services:
23  - name: Client
24    environment: chameleoncloud
25    cluster: compute_cascadelake_r
26    roles: [monitoring]
27    quantity: 1
Network Configuration
1networks:
2- src: cloud
3  dst: edge
4  delay: 180ms
5  rate: 1gbit
6  loss: 0.1%
Workflow Configuration
prepare installs stress on all Services.
launch runs stress on all Services.
 1# SERVER
 2- hosts: cloud.*
 3  prepare:
 4    - shell: apt install -y stress
 5  launch:
 6    - debug:
 7        msg: "Running"
 8    - shell: stress --cpu 32 --timeout 60
 9      async: 60
10      poll: 0
11# CLIENT
12- hosts: edge.*
13  prepare:
14    - shell: apt install -y stress
15  launch:
16    - debug:
17        msg: "Running"
18    - shell: stress --cpu 32 --timeout 60
19      async: 60
20      poll: 0
Running & Verifying Experiment Results
Find below the commands to run this example.
$ e2clab layers-services ~/git/monitoring-tig-chameleon/
                         ~/git/monitoring-tig-chameleon/
$ e2clab workflow ~/git/monitoring-tig-chameleon/ prepare
$ e2clab workflow ~/git/monitoring-tig-chameleon/ launch
You can access the Grafana service to visualize monitoring data during experiment
execution. You can access it as described in the following file
~/git/monitoring-tig-chameleon/20231016-105832/layers_services-validate.yaml. See
more details below:
'* * * * * * * Monitoring Service (started during workflow ''launch'' step)'
'Available at: http://localhost:3000'
'Access from your local machine: ssh -NL 3000:localhost:3000 cc@<FLOATING_IP>'
'username: admin / password: admin'
Note
Allocate a floating IP (public IP) using Chameleon’s dashboard. See Figure 1.
Assign the IP to the monitoring service. See Figures 2 and 3.
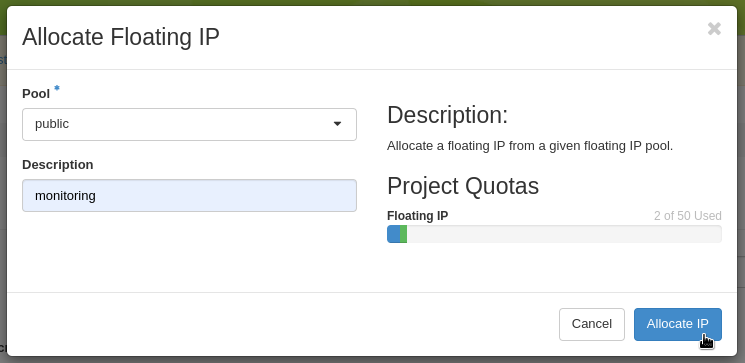
Figure 1: Allocating a floating IP (public IP) using Chameleon’s dashboard.
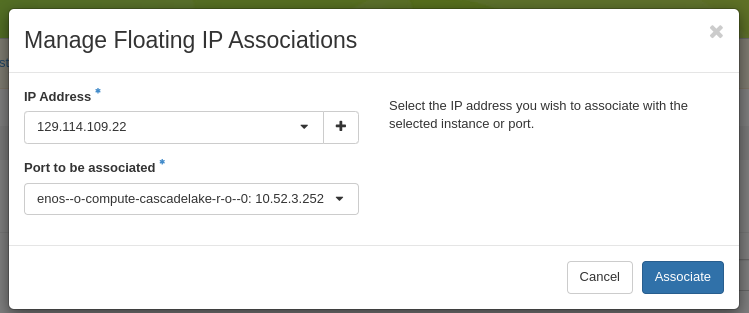
Figure 2: Assigning public IP to the monitoring service.
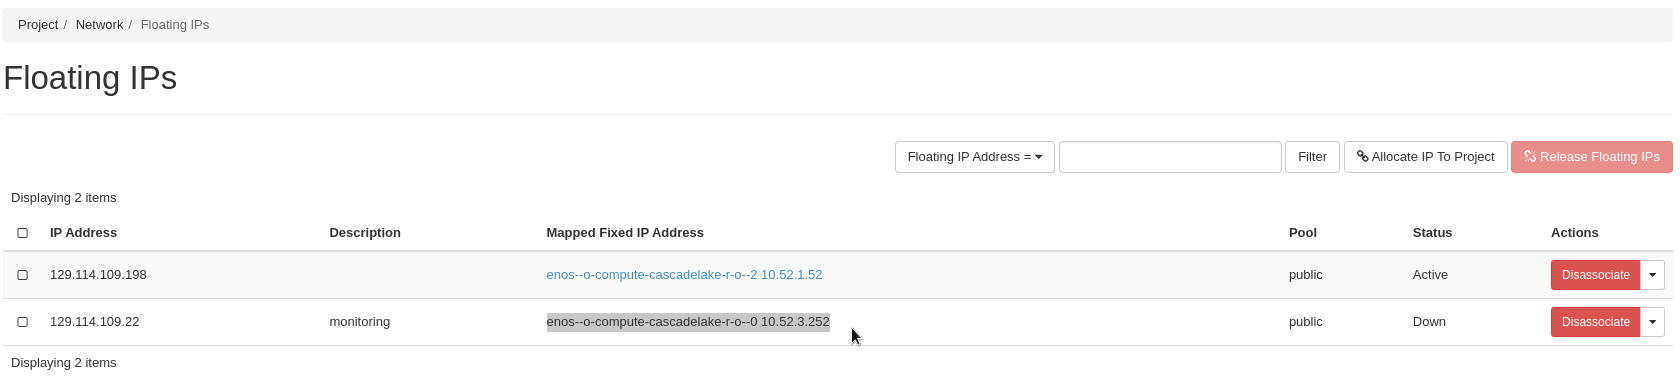
Figure 3: Chameleon cloud node with IP address allocated.
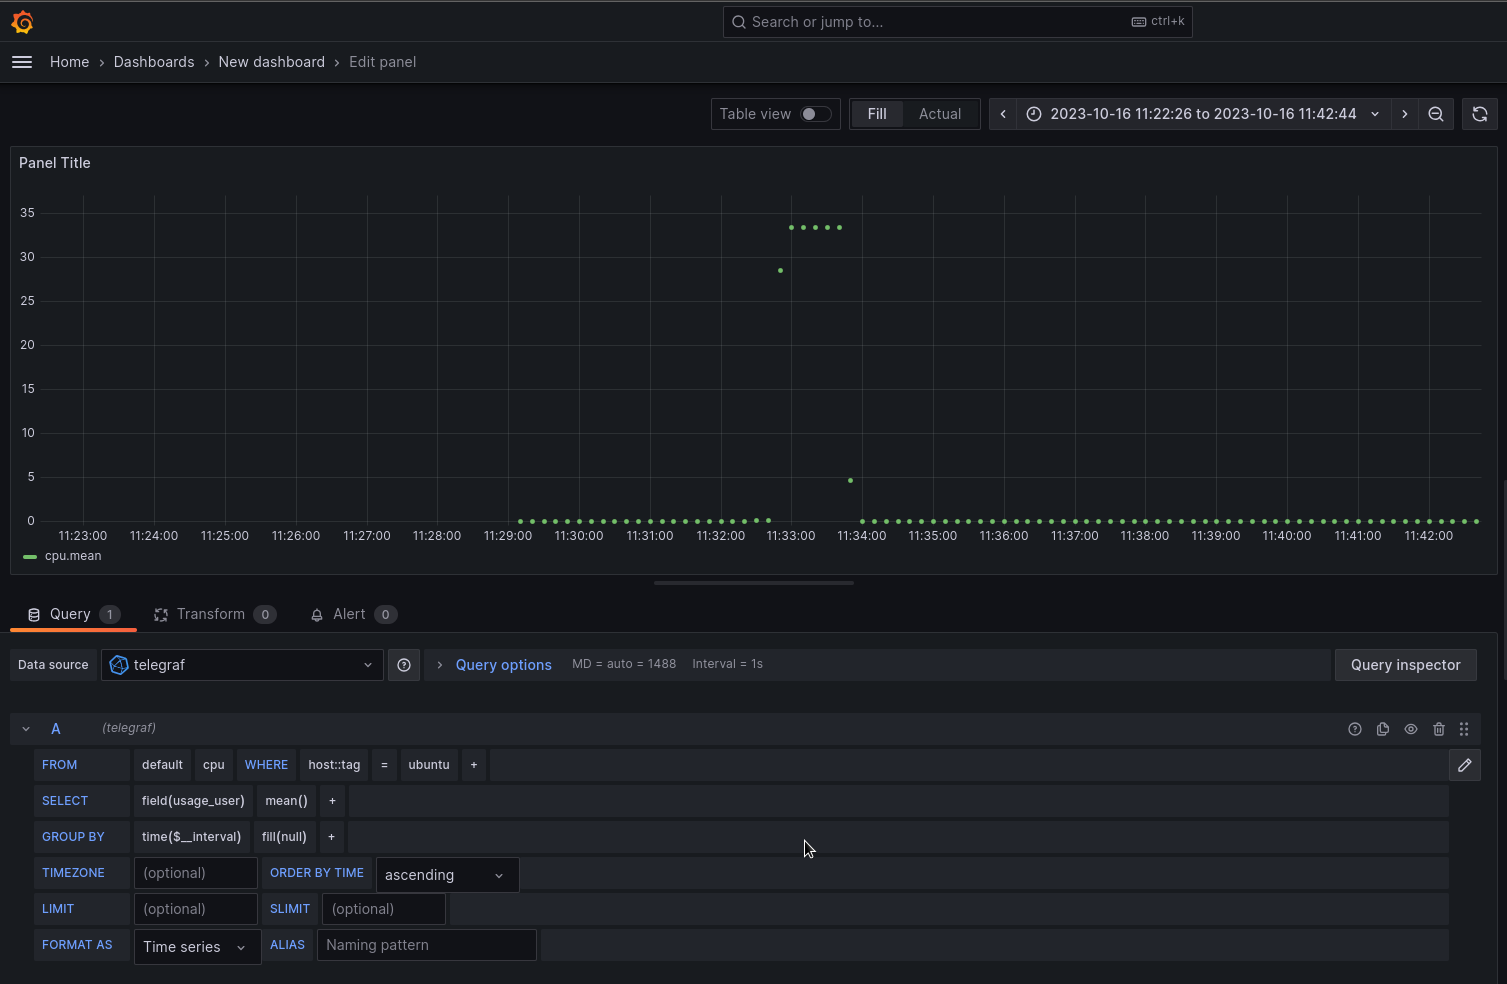
Figure 4: CPU usage on Chameleon cloud node ‘Server’.
Wait at least one minute before finalizing the workflow and saving the monitoring data.
$ e2clab finalize ~/git/monitoring-tig-chameleon/
The monitoring data will be saved at:
$ ls ~/git/monitoring-tig-chameleon/20231016-105832/monitoring-data/
influxdb-data.tar.gz