Flink Click Event Count
This example is depicted in Figure 1: Anatomy and is based on the Flink Operations Playground. This example consists of a Flink Cluster, a Kafka Cluster, and data producers.
In this example you will learn how to:
Configure a Flink Cluster and a Kafka Cluster.
Scale the number of producers (scale in and scale out).
Configure the network between producers and the Flink and Kafka clusters.
Manage and run Flink Jobs and data producers.
Check end-to-end execution.
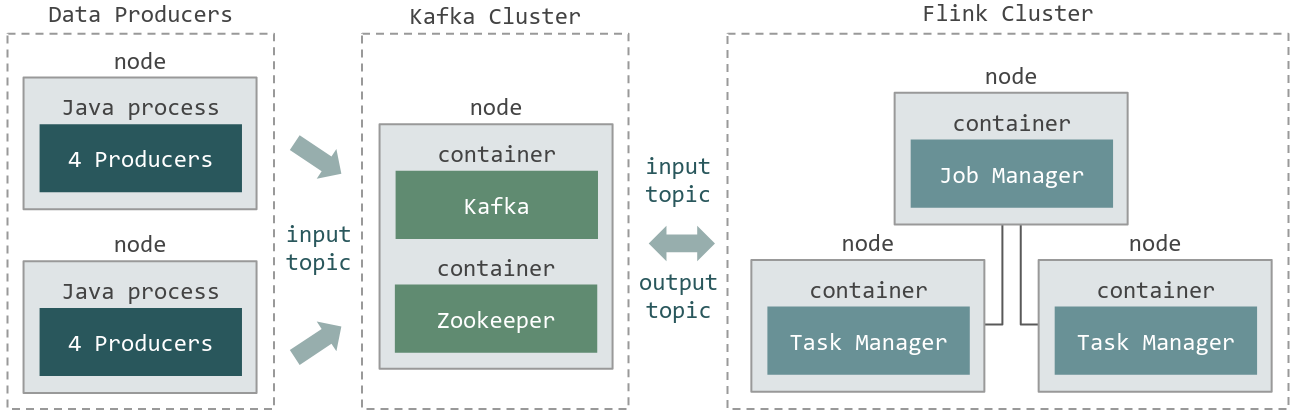
Figure 1: Anatomy
Experiment Artifacts
$ cd ~/git/
$ git clone https://gitlab.inria.fr/E2Clab/examples/flink-kafka
$ cd flink-kafka/
$ ls
artifacts          # contains Flink job (ClickCountJob.jar) and lib/
getting_started    # contains layers_services.yaml, network.yaml, and workflow.yaml
Defining the Experimental Environment
Layers & Services Configuration
This configuration file presents the layers and services that compose this example. The Flink Cluster (three nodes,
quantity: 3) is composed of one Job Manager and two Task Managers. The Kafka Cluster (single node, quantity: 1) consists of a
Zookeeper server and a Kafka Broker. Lastly, we have the data producers (two nodes, quantity: 1 and repeat: 1).
Note that, as we defined monitoring: type: dstat, all services will be monitored roles: [monitoring] during the execution of
the experiments using dstat.
 1environment:
 2  job_name: flink-example
 3  walltime: 01:00:00
 4  g5k:
 5    job_type: ["allow_classic_ssh"]
 6    cluster: parasilo
 7monitoring:
 8  type: dstat
 9layers:
10- name: cloud
11  services:
12  - name: Flink
13    quantity: 3
14    roles: [monitoring]
15    env:
16      FLINK_PROPERTIES: "jobmanager.heap.size: 2048m\n
17                         taskmanager.numberOfTaskSlots: 16\n
18                         taskmanager.heap.size: 768m"
19  - name: Kafka
20    quantity: 1
21    roles: [monitoring]
22- name: edge
23  services:
24  - name: Producer
25    roles: [monitoring]
26    quantity: 1
27    repeat: 1
User-Defined Service: add the following services in the ~/git/e2clab/e2clab/services/ directory.
Network Configuration
The file below presents the network configuration between the cloud and edge infrastructures delay: 5ms, loss: 2%, rate: 1gbit.
1networks:
2- src: cloud
3  dst: edge
4  delay: "5ms"
5  rate: "1gbit"
6  loss: "2%"
Workflow Configuration
This configuration file presents the application workflow configuration.
Regarding Flink Job Manager
cloud.flink.*.job_manager, inpreparewe are copying from the local machine to the remote machine the Flink Job. Inlaunchwe are copying it to the container and starting the Flink job.Regarding producers
edge.producer.*, inpreparewe are copying the producer java application and its libraries and then, inlaunchwe are starting four java processes. We used thedepends_onattribute to interconnect all producers to the Kafka server. In this case, they will be grouped in round robingrouping: "round_robin"and as presented inshell, producers were configured to send data to Kafka{{ kafka.url }}.
 1# FLINK
 2- hosts: cloud.flink.*.job_manager.*
 3  depends_on:
 4    service_selector: "cloud.kafka.*.leader.*"
 5    grouping: "round_robin"
 6    prefix: "kafka"
 7  prepare:
 8    - debug:
 9        msg: "Copying my Flink job to Job Manager {{ working_dir }}/ClickCountJob.jar"
10    - copy:
11        src: "{{ working_dir }}/ClickCountJob.jar"
12        dest: "/opt/ClickCountJob.jar"
13    - shell: "sudo docker cp /opt/ClickCountJob.jar {{ _self.container_name }}:/opt/"
14  launch:
15    - debug:
16        msg: "Starting my Flink job in Job Manager"
17    - shell: "sudo docker exec -it {{ _self.container_name }} flink run -d -p 32 /opt/ClickCountJob.jar
18                --bootstrap.servers {{ kafka.url }} --checkpointing --event-time"
19# PRODUCERS
20- hosts: edge.producer.*
21  depends_on:
22    service_selector: "cloud.kafka.*.leader.*"
23    grouping: "round_robin"
24    prefix: "kafka"
25  prepare:
26    - debug:
27        msg: "Copying producer libs"
28    - copy:
29        src: "{{ working_dir }}/ClickCountJob.jar"
30        dest: "/opt/ClickCountJob.jar"
31    - copy:
32        src: "{{ working_dir }}/lib/"
33        dest: "/opt/flink/lib/"
34  launch:
35    - debug:
36        msg: "Starting producers and connecting them with kafka (round robin)"
37    - shell: "java -classpath /opt/ClickCountJob.jar:/opt/flink/lib/* org.apache.flink.playgrounds.ops.clickcount.ClickEventGenerator
38                --bootstrap.servers {{ kafka.url }} --topic input"
39      async: 240
40      poll: 0
41      loop: "{{ range(1, 5)|list }}"
Running & Verifying Experiment Execution
Find below the commands to deploy this application and check its execution. Once deployed, you can check in the Flink WebUI
the configurations that we have defined in the layers-services.yaml and workflow.yaml configuration files, such as the
number of Task Managers, total task slots, Job Manager and Task manager heap size, job parallelism, etc.
(see Figure 2: Flink WebUI, Figure 3: Flink configurations, and Figure 4: Flink Job). Besides, you can also check the records
written to the Kafka Topics (input and output topics).
Running multiple experiments: in this example we are running four experiments
--repeat 3, each one with a duration of four minutes--duration 240.
$ e2clab deploy --repeat 3 --duration 240
                ~/git/flink-kafka/getting_started/
                ~/git/flink-kafka/artifacts/
Verifying experiment execution.
# Discover hosts in <yyyymmdd_hhmmss>/layers_services-validate.yaml file
$ cat layers_services-validate.yaml

# Tunnel to Flink Job Manager (cloud.flink.1.job_manager.1)
$ ssh -NL 8081:localhost:8081 <job_manager_node>.rennes.grid5000.fr

# SSH to Kafka Cluster (cloud.kafka.leader.1)
$ ssh <kafka_leader_node>.rennes.grid5000.fr

# Kafka input topic
$ sudo docker exec -it leader /usr/bin/kafka-console-consumer --bootstrap-server localhost:9092 --topic input
{"timestamp":"01-01-1970 12:04:32:235","page":"/news"}
{"timestamp":"01-01-1970 12:04:33:480","page":"/help"}
{"timestamp":"01-01-1970 12:04:33:255","page":"/about"}
{"timestamp":"01-01-1970 12:04:32:565","page":"/jobs"}
{"timestamp":"01-01-1970 12:04:32:745","page":"/jobs"}
{"timestamp":"01-01-1970 12:04:32:565","page":"/about"}

# Kafka output topic
$ sudo docker exec -it leader /usr/bin/kafka-console-consumer --bootstrap-server localhost:9092 --topic output
{"windowStart":"01-01-1970 12:00:45:000","windowEnd":"01-01-1970 12:01:00:000","page":"/index","count":7884}
{"windowStart":"01-01-1970 12:00:45:000","windowEnd":"01-01-1970 12:01:00:000","page":"/about","count":7882}
{"windowStart":"01-01-1970 12:00:45:000","windowEnd":"01-01-1970 12:01:00:000","page":"/jobs","count":7882}
{"windowStart":"01-01-1970 12:00:45:000","windowEnd":"01-01-1970 12:01:00:000","page":"/news","count":7880}
{"windowStart":"01-01-1970 12:00:45:000","windowEnd":"01-01-1970 12:01:00:000","page":"/shop","count":7884}
{"windowStart":"01-01-1970 12:00:45:000","windowEnd":"01-01-1970 12:01:00:000","page":"/help","count":7885}
In Figure 2: Flink WebUI you can check: the two Task Managers configured with 16 task slots each
taskmanager.numberOfTaskSlots: 16resulting inTotal Task Slots 32.
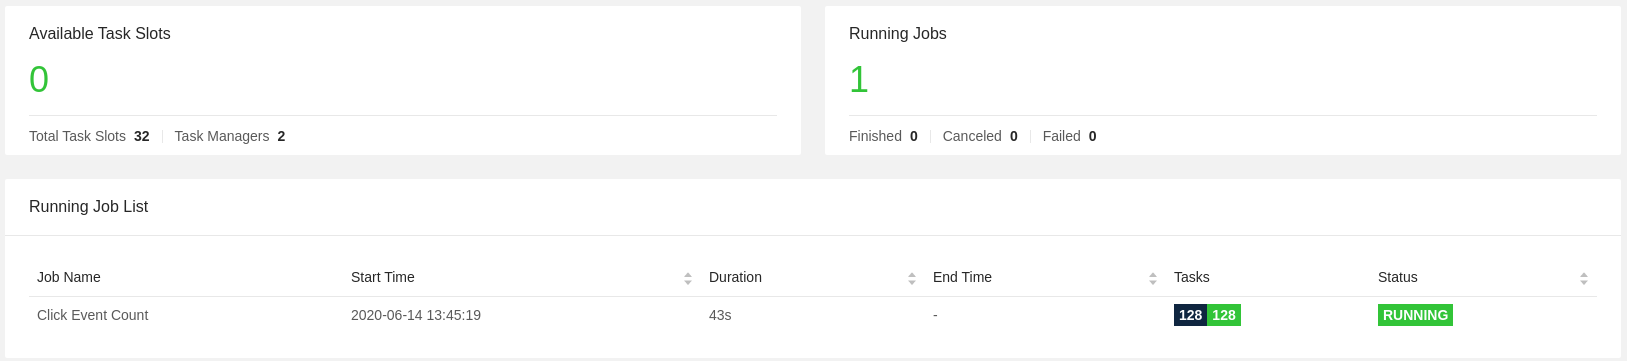
Figure 2: Flink WebUI
In Figure 3: Flink configurations you can check:
jobmanager.heap.size: 2048m,taskmanager.heap.size: 768m, andtaskmanager.numberOfTaskSlots: 16.
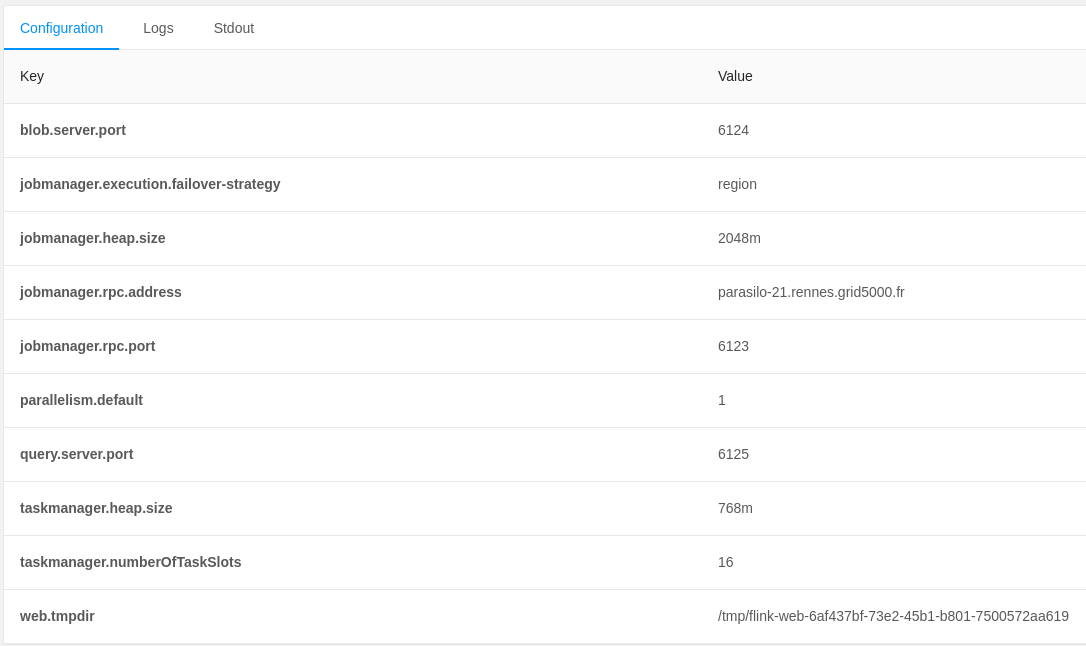
Figure 3: Flink configurations
In Figure 4: Flink Job you can check: the running job with
parallelism: 32.
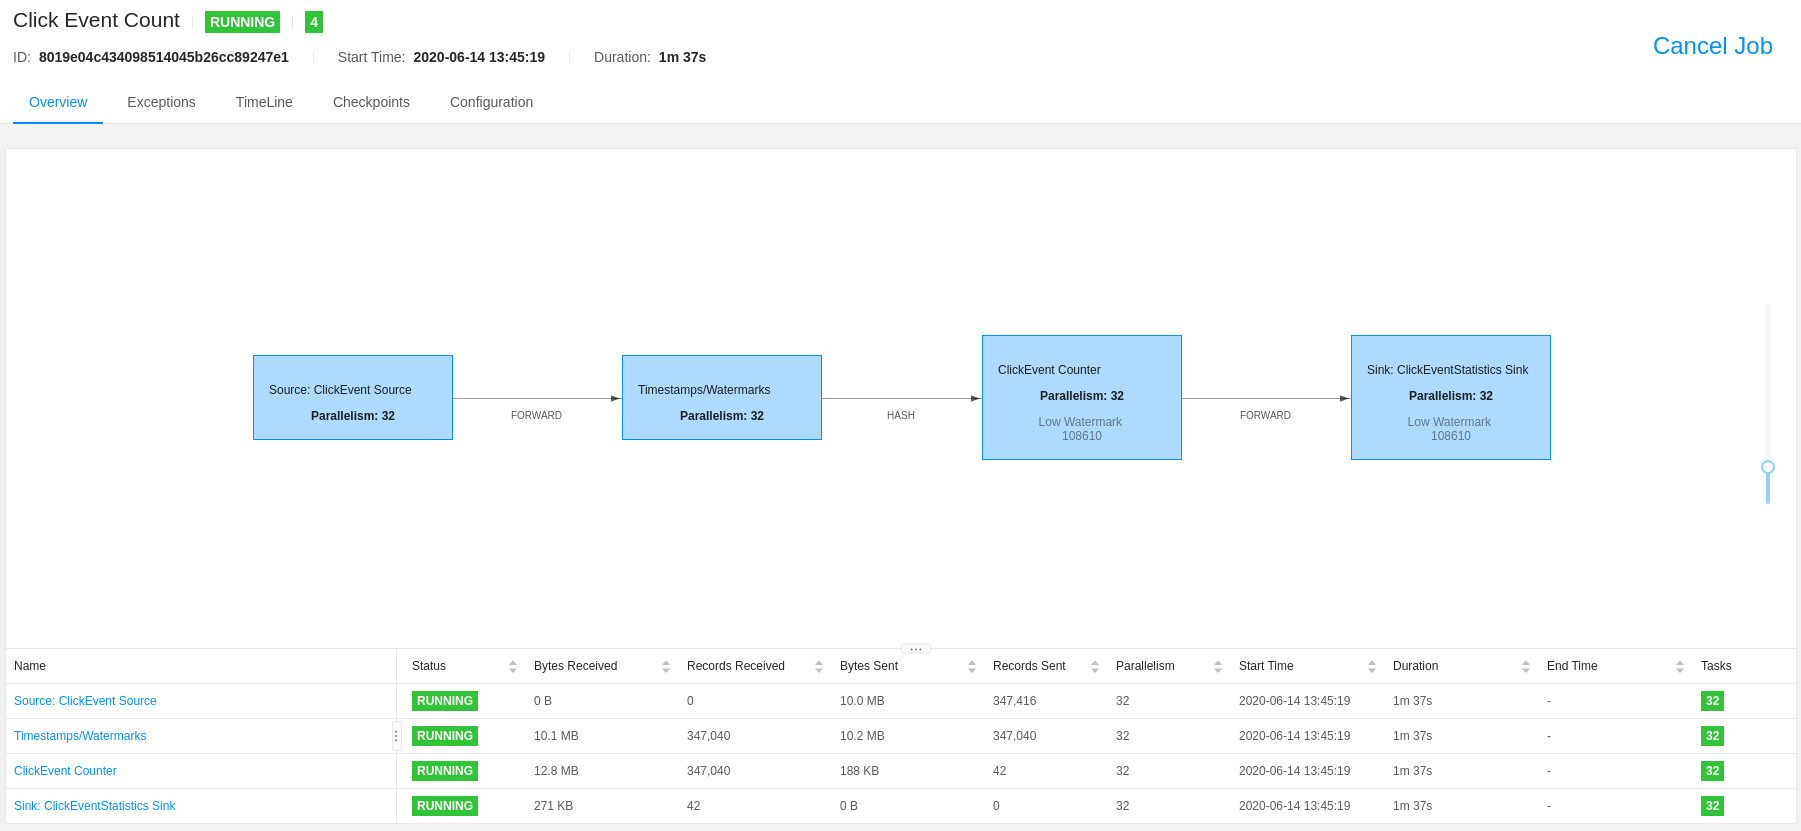
Figure 4: Flink Job
Deployment Validation & Experiment Results
Find below the files generated after the execution of each experiment. It consists of validation files
layers_services-validate.yaml, network-validate/, and workflow-validate.out, and monitoring data monitoring-data/.
Note that, for each experiment a new directory is generated yyyymmdd-hhmmss/.
$ ls ~/git/flink-kafka/getting_started/<yyyymmdd-hhmmss>/

monitoring-data/                # Monitoring data for each physical machine
layers_services-validate.yaml   # Mapping between layers and services with physical machines
network-validate/               # Network configuration for each physical machine
workflow-validate.out           # Commands used to deploy application (prepare, launch, and finalize)
Note
Providing a systematic methodology to define the experimental environment
(layers_services.yaml, network.yaml, and workflow.yaml) and
providing access to the artifacts supports the experiment Repeatability,
Replicability, and Reproducibility, see ACM Digital Library Terminology.