Dstat on G5K + FIT IoT LAB (power consumption)
Experiment Artifacts
The artifacts repository contains the E2Clab configuration files such as
layers_services.yaml, network.yaml, and workflow.yaml
$ cd ~/git/
$ git clone https://gitlab.inria.fr/E2Clab/examples/monitoring-energy-dstat-g5k-iotlab.git
$ cd monitoring-energy-dstat-g5k-iotlab/
Defining the Experimental Environment
Layers & Services Configuration
The monitoring type is dstat. In monitoring_iotlab we defined 2 profiles to
monitor power consumption in a8 nodes (name: test_capture_a8) and rpi3 nodes
(name: test_capture_rpi).
In addition, we added roles: [monitoring] in all services (e.g., MyServer, MyClientA,
and MyClientB) for dstat monitoring. For power monitoring, we added
profile: test_capture_a8 in MyClientA and profile: test_capture_rpi in
MyClientB.
 1---
 2environment:
 3  job_name: monitoring-energy-dstat-g5k-iotlab
 4  walltime: "00:59:00"
 5  g5k:
 6    cluster: paravance
 7    job_type: ["allow_classic_ssh"]
 8  iotlab:
 9    cluster: grenoble
10monitoring:
11  type: dstat
12monitoring_iotlab:
13  profiles:
14    - name: test_capture_a8
15      archi: a8
16      current: True
17      power: True
18      voltage: True
19      period: 8244
20      average: 4
21    - name: test_capture_rpi
22      archi: custom
23      current: True
24      power: True
25      voltage: True
26      period: 8244
27      average: 4
28layers:
29- name: cloud
30  services:
31  - name: MyServer
32    environment: g5k
33    roles: [monitoring]
34    quantity: 1
35- name: edge
36  services:
37  - name: MyClientA
38    environment: iotlab
39    cluster: grenoble
40    archi: a8:at86rf231
41    roles: [monitoring]
42    profile: test_capture_a8
43    quantity: 1
44  - name: MyClientB
45    environment: iotlab
46    cluster: grenoble
47    archi: rpi3:at86rf233
48    roles: [monitoring]
49    profile: test_capture_rpi
50    quantity: 1
Network Configuration
1networks:
2- src: cloud
3  dst: edge
4  delay: 180ms
5  rate: 1gbit
6  loss: 0.1%
Workflow Configuration
prepare installs stress on all Services.
launch runs stress on all Services.
 1# SERVER
 2- hosts: cloud.*
 3  prepare:
 4    - shell: apt install -y stress
 5  launch:
 6    - debug:
 7        msg: "Running"
 8    - shell: stress --cpu 32 --timeout 30
 9      async: 30
10      poll: 0
11# CLIENT
12- hosts: edge.myclienta.*
13  prepare:
14    - shell: pip3 install stress
15  launch:
16    - debug:
17        msg: "Running"
18    - shell: stress -c 1
19      async: 30
20      poll: 0
21- hosts: edge.myclientb.*
22  prepare:
23    - shell: pip3 install stress
24  launch:
25    - debug:
26        msg: "Running"
27    - shell: stress -c 4
28      async: 30
29      poll: 0
Running & Verifying Experiment Results
Find below the commands to run this example.
$ e2clab layers-services ~/git/monitoring-energy-dstat-g5k-iotlab/
                         ~/git/monitoring-energy-dstat-g5k-iotlab/
$ e2clab workflow ~/git/monitoring-energy-dstat-g5k-iotlab/ prepare
$ e2clab workflow ~/git/monitoring-energy-dstat-g5k-iotlab/ launch
Wait at least one minute before finalizing the workflow and saving the monitoring data.
$ e2clab finalize ~/git/monitoring-energy-dstat-g5k-iotlab/
The monitoring data will be saved at:
$ ls ~/git/monitoring-energy-dstat-g5k-iotlab/20230927-160723/monitoring-data/
node-a8-103.grenoble.iot-lab.info/      # dstat csv file
node-rpi3-1.grenoble.iot-lab.info/      # dstat csv file
paravance-19.rennes.grid5000.fr/        # dstat csv file


iotlab-energy/379944-grenoble.iot-lab.info.tar.gz
    379944/consumption/rpi3_1.oml
    379944/consumption/a8_103.oml
FIT IoT LAB provides an OML plotting tool to help to analyse monitoring data (github repo).
$ pip install oml-plot-tools
$ plot_oml_consum -p -c -v -i rpi3_1.oml
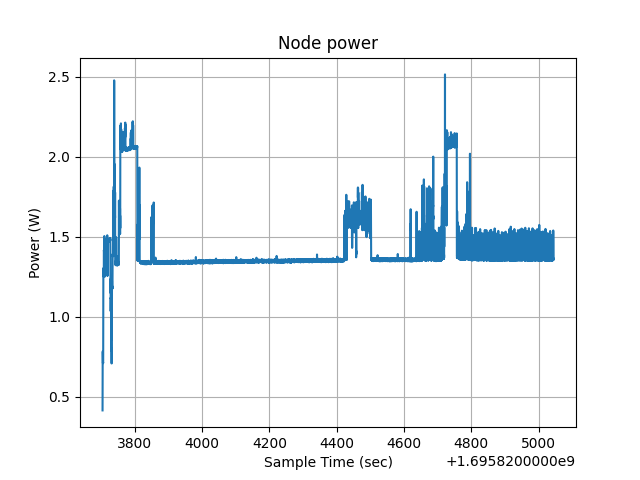
Figure 1: Power consumption on rpi3 node.
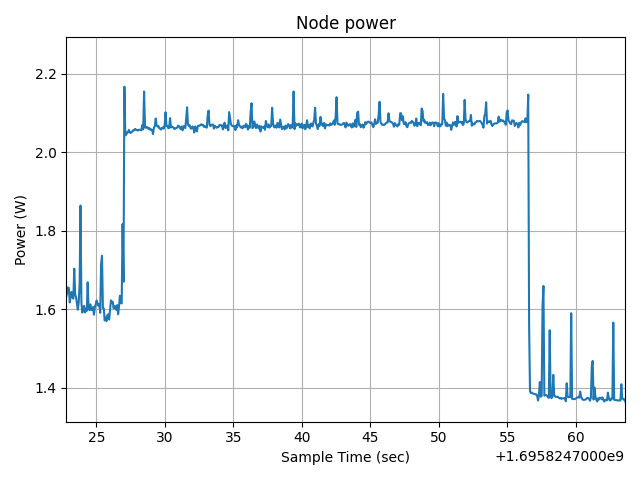
Figure 2: Power consumption on rpi3 node during “stress” execution for 30 seconds.